Business & Economy
US gas prices hit the highest August average on record
US regular gasoline averaged $4.055 a gallon in August, the dearest August in the EIA's weekly series since it began in 1990, and 29.5% above August 2025.
The average price of regular gasoline in the United States was $4.085 a gallon in the week to August 24, according to the Energy Information Administration's weekly survey, the third consecutive weekly increase and the highest reading since early June.
Averaged across its four weekly readings, August 2026 came in at $4.055 a gallon.
That makes this the most expensive August for American gasoline in the EIA's weekly series, which begins in August 1990. The previous high was $3.975 in August 2022, in the months after Russia's invasion of Ukraine pushed crude above $120 a barrel. These are nominal dollars, not adjusted for inflation, and on an inflation-adjusted basis several earlier Augusts were dearer. In the money drivers actually hand over, this is the record.
The August record, in the EIA's own numbers
| August | US average, regular | Change on prior year |
|---|---|---|
| 2026 | $4.055 | +29.5% |
| 2022 | $3.975 | +25.9% |
| 2023 | $3.840 | -3.4% |
| 2008 | $3.779 | |
| 2012 | $3.721 | |
| 2011 | $3.639 |
Source: US Energy Information Administration, weekly retail prices for regular grade, US average. Each figure is the mean of that month's weekly readings, calculated by USA Times. Nominal dollars.

The year-on-year move is the part households will recognise. August 2025 averaged $3.132 a gallon. August 2026 averaged $4.055. That is a rise of 92.3 cents, or 29.5%, in twelve months, and it has happened in a year when the Federal Reserve has been holding rates specifically to bring inflation down.
The shape of the year matters as much as the level
Gasoline did not climb steadily to this point. The 2026 peak came on May 11, when the weekly average hit $4.50, the highest reading since the summer of 2022. Prices then fell through June and July, bottoming at $4.006 in the week to August 10, before turning back up for three straight weeks.
That pattern, a sharp spring spike followed by an incomplete retreat, is why the annual comparison is so wide. The floor moved. A price that once looked like a spike is now the level prices return to when nothing in particular is happening.
For most of the last decade the American driver's mental anchor has been somewhere between $2.50 and $3.50. Every August from 2015 to 2020 printed under $3.20. Since 2021 not one has. The useful way to read $4.06 is not as a peak but as the new resting point, because it is what the market settled back to after a $4.50 spring.
Who pays for this, and where
A national average conceals a great deal. Gasoline is priced regionally, driven by refinery access, state fuel taxes and blend requirements, and the spread between the cheapest and dearest state routinely exceeds a dollar a gallon. LendingTree's August analysis found prices up in every state from a year earlier, a uniformity that points at crude and refining margins rather than at any state-level cause.
The distributional question is the sharper one. Gasoline is close to a fixed cost for households that cannot substitute away from it, which means a 92-cent rise is regressive by construction. NOTUS reported this month that the areas feeling the most pain from high gas prices are disproportionately those that voted for the president, a finding that follows mechanically from where in America people drive furthest to work.
An additional dollar a gallon on a 15,000-mile year in a 25 mile-per-gallon vehicle is about $554 a year. For a two-vehicle rural household it is roughly $1,100, before anything else in the budget has moved.
What this does to the inflation argument
The Federal Open Market Committee voted 9-3 in late July to hold the federal funds rate between 3.5% and 3.75%. Three regional presidents, Beth Hammack of Cleveland, Neel Kashkari of Minneapolis and Lorie Logan of Dallas, dissented on the grounds that inflation has now been above the 2% target for more than five years.
Energy is excluded from core inflation for good reasons: it is volatile, it is set globally, and monetary policy has limited purchase on it. But headline gasoline is what shapes inflation expectations, because it is the one price Americans see quoted in foot-high numerals several times a week and reprice against every time they fill up. A 29.5% annual increase in the most visible price in the economy is a problem for a central bank arguing that inflation is under control, whether or not it belongs in the core measure.
The committee meets next on September 15-16. Between now and then it will see one more month of gasoline data, and on the current three-week trend that data will not help its case.
What to watch
Three things determine whether the August figure is a top or a step.
The first is the refining calendar. The switch back to cheaper winter-blend gasoline usually pulls prices down from mid-September, and the size of that drop this year will show how much of the current level is seasonal and how much is structural.
The second is crude, where the sanctions posture towards Iran is the live variable. Treasury officials have signalled a further major sanctions announcement, and the market prices geopolitical risk into crude before it appears at the pump.
The third is the tariff schedule. Duties on imported goods raise transport-intensive costs across the economy, and the 50% tariff that took effect on Canadian goods on August 22 arrived in the same week gasoline turned back up. Canada is the largest single foreign supplier of crude oil to the United States, which makes the trade dispute and the pump price the same story more often than either is reported as such.
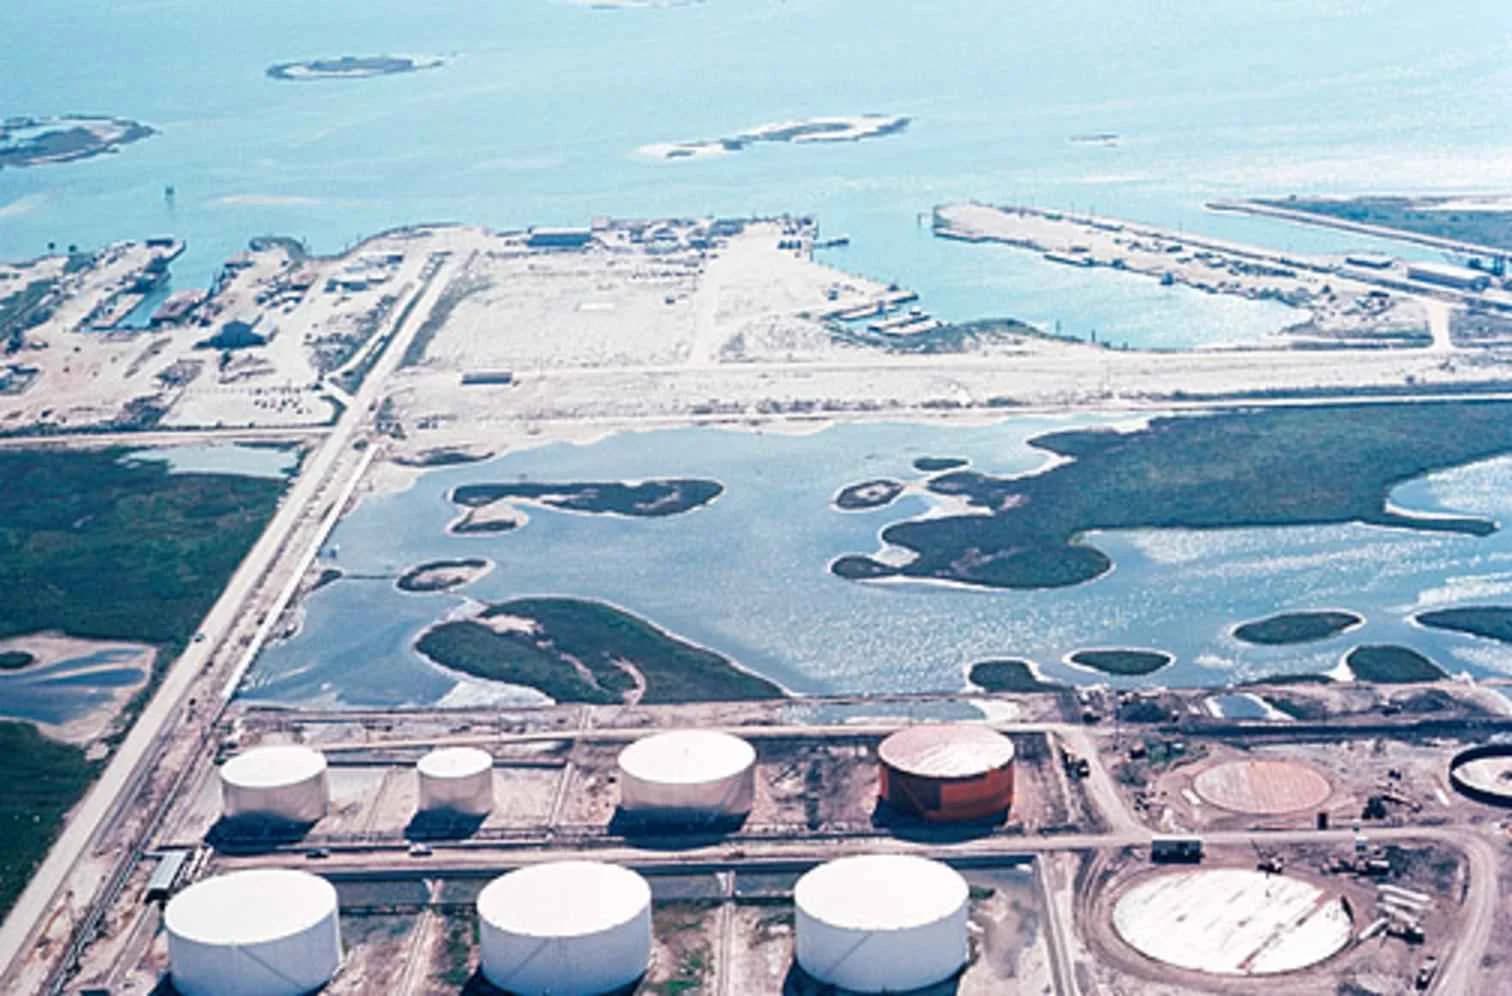
Cover photograph: an oil refinery on the Texas coast. Public domain, via Wikimedia Commons.
About the author
Daniel Reyes
Daniel Reyes is a senior correspondent at USA Times, reporting on the economy, markets, housing, and American business.
Keep reading
More from USA Times

US 50% tariff hits Canada, autos and steel follow in January
A 50% US tariff on about $20bn of Canadian goods took effect August 22, with cars, parts and steel added on January 1. USA Times sizes the January base at roughly $45bn a year.
Daniel Reyes / August 28, 2026
US national debt tops $40 trillion after 9-year doubling
Treasury's Debt to the Penny series closed at $40.07 trillion on August 26. USA Times' review of the daily ledger puts federal borrowing at $7.37 billion a day this fiscal year.
Daniel Reyes / August 28, 2026

Bessent launches global Iran sanctions as US gas hits $4.09
Treasury's Operation Economic Outcast threatens Iran's trading partners worldwide. USA Times sets the campaign against EIA pump prices: US gasoline is up $1.15 a gallon in six months.
Ellen Marsh / August 28, 2026